Garnet Framework has evolved with architectural improvements for better cost efficiency and scalability. This documentation is current and reflects these changes, though we continue to expand certain sections with additional examples and detailed guidance.
Thank you for your patience as we complete this update.
Building Context Consumers
Context Consumers are applications and services that consume data from Garnet Framework to extract insights, detect patterns, and trigger actions. These range from traditional applications like dashboards displaying real-time operational conditions and analytics platforms processing historical trends, to intelligent systems such as autonomous agents making decisions based on contextual awareness, notification systems triggering alerts when specific conditions are met, and ML inference engines analyzing patterns to predict outcomes.
Context Consumers can also act as Context Producers, creating intelligent feedback loops - for example, an autonomous AI agent performing an action based on current context can store the results back into the knowledge graph, or a system performing ML inference can contribute its predictions either as new contextual entities or as attributes on existing entities, such as adding a predicted maintenance state to a machine entity or weather forecasts to location entities, enabling other consumers to leverage these insights.
The key advantage for Context Consumers is that Garnet Framework provides data with a standardized NGSI-LD information model, regardless of the original data source. This consistency enables applications to focus on business logic rather than data integration challenges, while the ability to contribute back to the knowledge graph creates powerful feedback loops that enhance the overall system intelligence.
Building Context Consumer Applications
Context Consumers can access data from Garnet through multiple flexible patterns designed to meet diverse application requirements. Pull-based patterns enable applications to fetch data on-demand using the NGSI-LD Context Broker API, while push-based patterns provide real-time updates through NGSI-LD subscriptions. Historical analysis is available through Amazon Athena querying data stored in S3 for analytics and reporting, while hybrid approaches combine multiple access patterns to meet specific requirements.
Real-time applications can leverage AWS Amplify Pub/Sub to subscribe to MQTT topics where NGSI-LD subscription notifications are sent, enabling responsive dashboards and applications. AI agents can fetch data directly from Garnet Framework as a tool for decision-making, with an upcoming MCP (Model Context Protocol) interface to streamline AI agent integration.
When Context Consumers need to consume data in specific formats due to existing system constraints or legacy requirements, Garnet Framework provides the flexibility to create in-flight mapping between NGSI-LD and the required format. This capability enables seamless integration with existing applications that cannot be modified to consume NGSI-LD directly. Through transformation layers, API gateways, or middleware components, you can convert the standardized NGSI-LD data into any format your existing systems expect, whether it's proprietary JSON schemas, XML formats, or database-specific structures. This approach demonstrates Garnet's flexibility and ensures that adopting the framework doesn't require replacing existing systems, but rather enhances them with unified contextual data.
Garnet Framework is completely agnostic in terms of visualization and analytics tools, enabling flexible integration through the access patterns described above. Grafana (or its fully managed version Amazon Managed Grafana) provides powerful dashboarding capabilities for both real-time API data and historical data queried through Athena, while Amazon QuickSight creates interactive dashboards and reports from historical data stored in S3 and queried through Athena. For 3D visualization and digital twins, tools like Cesium (a platform for 3D geospatial applications) and Matterport (a platform for creating digital twins of physical spaces) can be easily integrated with Garnet Framework.
Context Consumer Examples
Let's explore practical implementations for different consumption patterns, demonstrating how to leverage Garnet's unified data model in various scenarios. These are code snippets and implementation tips to provide direction rather than comprehensive guides. For more detailed implementation guidance, refer to the tutorials section.
Monitoring with Grafana
Grafana provides powerful visualization capabilities for both current state and historical data from Garnet Framework. You can configure Grafana to query the NGSI-LD Context Broker API for current entity states and use Amazon Athena as a data source for historical analysis.
Scenario: Smart Building Operations Dashboard
Consider a facility management company that needs to monitor environmental conditions, energy consumption, and occupancy across multiple buildings. The dashboard must display current sensor readings alongside historical trends to identify patterns and optimize building operations.
- Overview
- Setup Steps
The Grafana dashboard integrates with Garnet by:
- Configuring the NGSI-LD API as a data source for current state queries
- Setting up Amazon Athena connection for historical data analysis
- Creating panels that combine current state with temporal trends
- Enabling drill-down capabilities from summary views to detailed entity information
1. REST API Data Source:
- Configure a data source plugin that can query REST APIs to connect to your Garnet NGSI-LD endpoint
- Point it to your Garnet API URL with proper authentication headers
2. Amazon Athena Data Source:
- Install and Configure Athena Plugin - Complete setup guide including IAM permissions
3. Create Dashboard and Panels:
For basic dashboard creation, refer to Grafana Fundamentals Tutorial.
Steps:
- Create new dashboard → Add visualization
- Select Athena data source
Example: Room Temperature Time Series Panel
Detailed Steps:
- In your dashboard, click "Add" → "Visualization"
- In the panel editor, select your Athena data source from the dropdown
- In the query editor (bottom section), paste this SQL query (using the same data from the historical data analysis section):
SELECT
    id,
    name.value as room_name,
    temperature.value as temperature,
    from_iso8601_timestamp(temperature.observedAt) as temperature_observed_at,
    from_iso8601_timestamp(temperature.modifiedAt) as temperature_modified_at,
    from_iso8601_timestamp(createdAt) as entity_created_at,
    from_iso8601_timestamp(modifiedAt) as entity_modified_at
FROM garnetdb.room
WHERE type = 'Room'
    AND dt BETWEEN date_format(date_add('day', -30, now()), '%Y-%m-%d-00') AND date_format(date_add('day', 1, now()), '%Y-%m-%d-00')
ORDER BY temperature_observed_at
LIMIT 10
- Click "Run query" to test the data retrieval
- In the panel options (right sidebar):
- Set visualization type to "Time series"
- In the Column dropdown, select
temperature_observed_atas the time field - Set Y-axis label to "Temperature (°C)" in the Axis settings
- Add thresholds in the "Thresholds" section for normal/warning/critical ranges
- Save the panel with a descriptive title like "Room Temperature Over Time"
This approach enables facility managers to monitor current conditions while analyzing historical patterns to optimize HVAC systems and predict maintenance needs.
City-Scale Digital Twin with Cesium
Cesium enables the creation of 3D visualizations by fetching entity data from Garnet and displaying them on interactive 3D maps. This approach is particularly useful for applications where spatial context enhances data understanding and decision-making.
Scenario: Bike Sharing Station Monitoring
Consider a city that operates bike sharing stations and wants to visualize station locations, bike availability, and usage patterns on a 3D map. This helps city planners understand usage patterns and optimize station placement.
- Overview
- Setup Steps
- Angular Example
The Cesium integration works by:
- Setting up a Cesium Ion account and obtaining an access token
- Installing Cesium dependencies in your project (this example uses Angular, but the same approach works with React, Vue, or any other framework)
- Fetching bike station data from Garnet's NGSI-LD API
- Visualizing stations as color-coded bike icons and 3D striped boxes based on availability
- Creating interactive 3D elements that can be selected and extended with custom functionality
The result is an interactive 3D map where city operators can quickly assess bike station status across the entire network, identify stations that need restocking or maintenance, and understand usage patterns in their spatial context.
For comprehensive Cesium development guidance with different frameworks, see the Cesium QuickStart Guide.
Step 1: Create New Angular Project
ng new garnet-cesium-app
cd garnet-cesium-app
Step 2: Install Cesium Dependencies
npm install cesium @types/cesium
Step 3: Configure Angular for Cesium (Manual Configuration Required)
Cesium requires manual configuration in Angular. Update your angular.json file in the build.options.assets array:
"assets": [
  {
    "glob": "**/*",
    "input": "public"
  },
  {
    "glob": "**/*",
    "input": "node_modules/cesium/Build/Cesium/Workers",
    "output": "cesium/Workers"
  },
  {
    "glob": "**/*",
    "input": "node_modules/cesium/Build/Cesium/ThirdParty",
    "output": "cesium/ThirdParty"
  },
  {
    "glob": "**/*",
    "input": "node_modules/cesium/Build/Cesium/Assets",
    "output": "cesium/Assets"
  },
  {
    "glob": "**/*",
    "input": "node_modules/cesium/Build/Cesium/Widgets",
    "output": "cesium/Widgets"
  }
]
And in the build.options.styles array:
"styles": [
  "src/styles.scss",
  "node_modules/cesium/Build/Cesium/Widgets/widgets.css"
]
Step 4: Get Cesium Ion Access Token
- Go to Cesium Ion and create a free account
- Navigate to "Access Tokens" in your dashboard
- Copy your default access token (or create a new one)
Note: This example uses Angular, but the same approach works with React, Vue, vanilla JavaScript, or any other web framework.
Step 5: Add Icons to Your Project
Create the following icon files in your public/icons/ folder:
red-bike.png- Icon for low availability stationsgreen-bike.png- Icon for high availability stations
Step 6: Update your src/app/app.ts (Angular 20 uses standalone components):
import { Component, AfterViewInit, ElementRef, ViewChild } from '@angular/core';
import * as Cesium from 'cesium';

@Component({
  selector: 'app-root',
  template: '<div #cesiumContainer style="width: 100vw; height: 100vh;"></div>',
  standalone: true
})
export class App implements AfterViewInit {
  @ViewChild('cesiumContainer', { static: true }) cesiumContainer!: ElementRef;

  // Replace with your actual tokens and API URL
  cesiumToken: string = 'your-cesium-ion-token-here';
  assetId: number = 2275207; // Your Cesium Ion asset ID for 3D tiles
  garnetApiUrl: string = 'https://your-garnet-api.com';
  garnetToken: string = 'your-garnet-api-token';
  entityType: string = 'BikeHireDockingStation';

  async ngAfterViewInit() {
    (window as any).CESIUM_BASE_URL = '/cesium/';
    Cesium.Ion.defaultAccessToken = this.cesiumToken;

    const viewer = new Cesium.Viewer(this.cesiumContainer.nativeElement, {
      globe: false,
      animation: false,
      baseLayerPicker: false,
      navigationHelpButton: false,
      sceneModePicker: false,
      homeButton: false,
      infoBox: false,
      geocoder: false,
      fullscreenButton: false,
      timeline: false
    });

    try {
      const tileset = await Cesium.Cesium3DTileset.fromIonAssetId(this.assetId);
      viewer.scene.skyAtmosphere.show = true;
      viewer.scene.primitives.add(tileset);
    } catch (error) {
      console.error('Failed to load Google 3D Tiles. Please check your Asset ID and token.');
    }

    viewer.camera.flyTo({
      destination: Cesium.Cartesian3.fromDegrees(-0.09729332148093964, 51.49921585698301, 800),
      orientation: {
        heading: Cesium.Math.toRadians(-10.0),
        pitch: Cesium.Math.toRadians(-20)
      }
    })

    // Fetch and display BikeHireDockingStation entities (non-blocking)
    fetch(`${this.garnetApiUrl}/ngsi-ld/v1/entities?type=${this.entityType}`, {
      headers: { 'Authorization': this.garnetToken, 'Content-Type': 'application/json' }
    }).then(response => response.json())
    .then(entities => {
      entities.forEach((entity: any) => {
        const long = entity.location.value.coordinates[0];
        const lat = entity.location.value.coordinates[1];

        // Get bikes available and free slots from the entity data
        const bikesAvailable = entity.availableBikeNumber?.value || 0;
        const freeSlots = entity.freeSlotNumber?.value || 0;
        const totalSlots = entity.totalSlotNumber?.value || 0;

        // Calculate availability ratio (avoid division by zero)
        const availabilityRatio = totalSlots > 0 ? bikesAvailable / totalSlots : 0;

        // Use ratio to determine color and icon (green if more than 50% bikes available)
        const isHighAvailability = availabilityRatio > 0.5;
        const color = isHighAvailability ? Cesium.Color.PALEGREEN.withAlpha(0.4) : Cesium.Color.PINK.withAlpha(0.4);

        // Add billboard icon and box as a single entity
        const billboardScale = 0.5;
        // Select bike icon based on availability ratio
        const selectedImage = isHighAvailability ? 'icons/green-bike.png' : 'icons/red-bike.png';

        viewer.entities.add({
          id: entity.id,
          position: Cesium.Cartesian3.fromDegrees(long, lat, 180),
          billboard: new Cesium.BillboardGraphics({
            image: selectedImage,
            scaleByDistance: new Cesium.NearFarScalar(1000, (billboardScale + 0.1), 2000, billboardScale - 0.2),
            scale: billboardScale,
            heightReference: Cesium.HeightReference.RELATIVE_TO_TERRAIN,
            horizontalOrigin: Cesium.HorizontalOrigin.CENTER,
            verticalOrigin: Cesium.VerticalOrigin.BOTTOM,
            show: true
          }),
          box: new Cesium.BoxGraphics({
            dimensions: new Cesium.Cartesian3(10, 10, 300),
            outline: false,
            material: new Cesium.StripeMaterialProperty({
              evenColor: color,
              orientation: Cesium.StripeOrientation.HORIZONTAL,
              offset: 1.20, // Reduced offset to make stripes taller
              oddColor: Cesium.Color.WHITE.withAlpha(0.6)
            })
          })
        });
      });
    }).catch(error => console.error('CORS or API error:', error));
  }
}
Important Notes:
-
Data Model Adaptation: The availability ratio calculation uses
availableBikeNumber,freeSlotNumber, andtotalSlotNumberattributes from the BikeHireDockingStation entity. If your entities use different attribute names, update the code accordingly:const bikesAvailable = entity.yourAvailableBikesAttribute?.value || 0;
const freeSlots = entity.yourFreeSlotsAttribute?.value || 0;
const totalSlots = entity.yourTotalSlotsAttribute?.value || 0; -
Icon Requirements: Place your bike station icons in the
public/icons/folder:red-bike.pngfor low availability (ratio ≤ 0.5)green-bike.pngfor high availability (ratio > 0.5)
-
Visualization Elements: Each station displays both a color-coded bike icon and a 3D striped box. The icon shows availability at a glance, while the box provides additional visual context with color-coded stripes.
For comprehensive Cesium Viewer API documentation and advanced interaction patterns, see the Cesium Viewer Reference.
Step 7: Run the application:
ng serve
Your bike station visualization will show color-coded bike icons on a photorealistic 3D map, with green icons for high availability stations and red icons for low availability stations.
This example uses Google's photorealistic 3D tiles for realistic city visualization. You can also upload your own 3D building models and tilesets to Cesium Ion - see the 3D Tiling Buildings guide for creating custom 3D tiles from your own data.
This simple implementation creates a 3D map showing bike station locations with color-coded availability indicators. Stations with high availability (>50%) display green icons, while stations with low availability (≤50%) display red icons, helping city operators quickly identify stations that need attention.
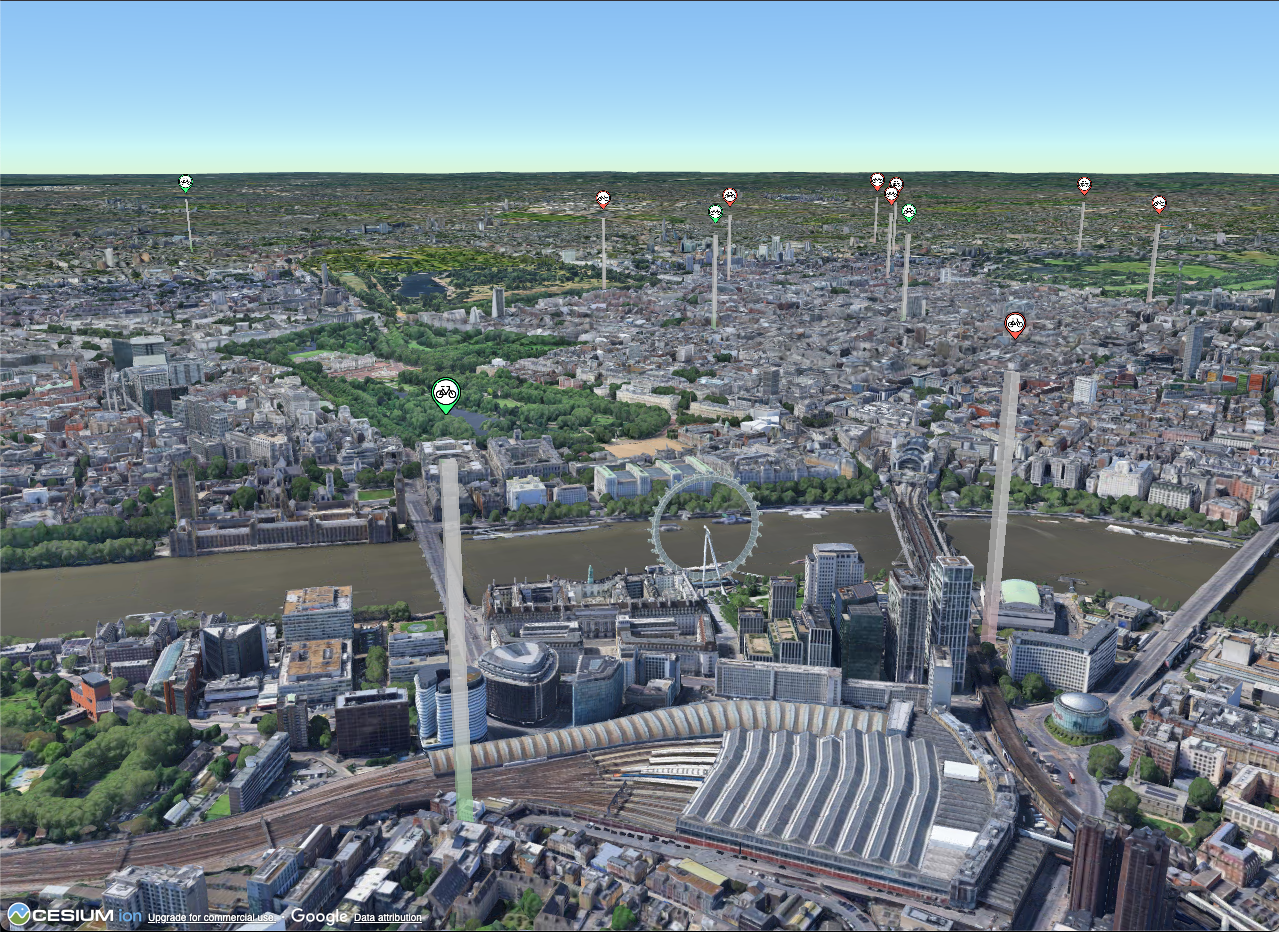
Advanced Integration Demo: For a comprehensive demonstration of Cesium digital twins integrated with AI agents and advanced Garnet Framework capabilities, see our LEAP 2024 Demo blog post showcasing real-world applications.
For more complex urban planning scenarios, this same approach can be extended to visualize comprehensive city data including bus routes, traffic patterns, employment centers, and demographic information. Such integrated visualizations enable policy makers to identify service gaps, optimize resource allocation, and simulate the impact of infrastructure changes before implementation. The 3D spatial context helps stakeholders understand complex urban relationships that traditional charts and graphs cannot effectively communicate.
Additional Context Consumer Examples
We are currently updating this documentation with additional Context Consumer examples and implementation guides. The following sections are being reviewed and enhanced:
- Immersive Visualization with Matterport - 3D spatial model integration for retail analytics and facility management
- Real-time Applications with AWS Amplify Pub/Sub - Building responsive applications with NGSI-LD subscriptions
- AI Agent Integration - Leveraging Garnet as a data source for intelligent decision-making systems
Please check back regularly for updates as we continue to expand and improve our documentation.
Next Steps
With Context Consumers accessing data from your knowledge graph, you can build sophisticated applications that leverage unified contextual intelligence. The flexibility of Garnet's data access patterns enables everything from simple dashboards to complex AI-driven systems.
You can explore practical examples in the tutorials section that demonstrate complete end-to-end implementations combining Context Producers with various Context Consumer patterns.