Analyzing Historical Data
Garnet Framework has evolved with architectural improvements for better cost efficiency and scalability. This documentation is current and reflects these changes, though we continue to expand certain sections with additional examples and detailed guidance.
Thank you for your patience as we complete this update.
Garnet Framework automatically captures the evolution of your knowledge graph through a customized version of the NGSI-LD Scorpio Context Broker. Every change to your context information is automatically published to Amazon Kinesis Data Firehose, which continuously delivers this data to an Amazon S3 data lake, requiring no additional configuration or management.
Understanding the Data Lake
While the NGSI-LD temporal interface provides immediate access to historical entity states, as we explored in the previous section, the data lake complements these capabilities by enabling efficient analysis of large-scale historical data through SQL. When analyzing patterns across hundreds of rooms over several months, or investigating correlations between occupancy and energy usage across multiple buildings, the data lake provides a more efficient approach than temporal API queries.
When you deploy Garnet, the framework automatically creates an Amazon Athena workgroup named garnet with a preconfigured query results location, and establishes a database named garnetdb in the AWS Glue Data Catalog.
Behind the scenes, the data lake implementation uses Amazon Data Firehose to efficiently buffer and deliver context changes to Amazon S3. The Firehose stream buffers data based on two configurable parameters: time interval (60 seconds by default) or buffer size (64 MB by default). Whichever threshold is reached first triggers the delivery to S3. These parameters can be adjusted in the constants.ts file to optimize for your specific use case.
The data in S3 is automatically organized using dynamic partitioning, creating a structured hierarchy that enhances query performance and reduces costs. The partitioning strategy follows this pattern:
type=<entity-type>/dt=YYYY-MM-DD-HH/
For example, all NGSI-LD entities of type Room and their complete context (including all their attributes and relationships) would be stored in:
type=Room/dt=2024-02-23-14/garnet-datalake-firehose-stream-1-2024-02-23-14-31-xxxxxx.json
This partitioning structure enables Athena to efficiently process queries by reading only the relevant partitions. When querying entities of a specific type during a particular time window, Athena can skip irrelevant partitions, significantly reducing the amount of data scanned and, consequently, the query cost.
In case of processing errors, the Firehose stream automatically redirects failed records to an error prefix:
type=error-output-type/dt=YYYY-MM-DD-HH/
This separation of valid and error data enables straightforward monitoring and troubleshooting of data delivery issues.
Working with Historical Data
To analyze your historical context data, you first need to create tables in Athena that match your entity structures. Open the Amazon Athena console and ensure you're working in the garnet workgroup with the AwsDataCatalog data source and garnetdb database.
Building on our smart building scenario, we'll create a table for Room entities that maps to the data structure stored in the S3 data lake. Note that you'll need to replace {GarnetDataLakeBucket} with your actual S3 bucket name in the following SQL statements.
To make this documentation more user-friendly, each SQL query is presented in a tabbed format:
- The Summary tab provides a concise explanation of what the query does and why you might use it
- The SQL tab contains the complete query that you can copy and paste into Athena
This approach allows you to quickly understand the purpose of each query without getting overwhelmed by SQL syntax, while still having easy access to the full code when you need it.
- Summary
- SQL
This SQL statement creates an external table that:
- Defines the structure of Room entities in your data lake
- Specifies fields like entity ID and temporal metadata
- Creates nested structures for properties like temperature
- Configures partitioning by entity type and datetime

After creating this table, you can immediately start querying your historical Room data.
CREATE EXTERNAL TABLE IF NOT EXISTS
garnetdb.room (
  id string,
  createdAt string,
  modifiedAt string,
  scope string,
  name struct<
    createdAt: string,
    value: string,
    modifiedAt: string
  >,
  temperature struct<
    createdAt: string,
    value: double,
    modifiedAt: string,
    observedAt: string,
    unitCode: string
  >,
  inBuilding struct<
    createdAt: string,
    object: string,
    objectType: string,
    modifiedAt: string
  >
)
PARTITIONED BY (
    type string,
    dt string
)
ROW FORMAT serde 'org.openx.data.jsonserde.JsonSerDe'
WITH SERDEPROPERTIES (
'serialization.format' = '1',
'ignore.malformed.json' = 'true'
)
LOCATION 's3://{GarnetDataLakeBucket}/' -- Replace {GarnetDataLakeBucket} with your actual S3 bucket name
TBLPROPERTIES (
    'classification'='json',
    'projection.type.values' = 'Room',
    'projection.enabled'= 'true',
    'projection.dt.type'= 'date',
    'projection.dt.format' = 'yyyy-MM-dd-HH',
    'projection.dt.range' = '2024-01-01-00,NOW',
    'projection.dt.interval' = '1',
    'projection.dt.interval.unit' = 'HOURS',
    'projection.type.type' = 'enum'
)
This SQL statement creates an external table that defines the structure of Room entities in our data lake. It specifies fields like entity ID, temporal metadata fields (createdAt and modifiedAt that track when entities were created and last modified), and nested structures for properties like temperature (which includes its own temporal metadata such as observedAt for when measurements were taken).
The statement configures partitioning by entity type and datetime, enabling Athena to efficiently query only relevant data partitions. The table points directly to the S3 location where Firehose delivers the data, with partition projection automatically handling new data without manual intervention.
After creating this table, you can immediately start querying your historical Room data without having to manually manage partitions or data loading.
Analyzing Historical Data
The SQL queries in this section demonstrate analytical techniques that reveal their full potential when applied to large-scale deployments. While our examples use a specific scenario, these same approaches can be applied to any domain and will help you discover valuable patterns and insights as your data grows over time.
Let's begin with a simple exploratory query to understand the data available in our data lake:
- Summary
- SQL
This query retrieves essential room information from the last 30 days:
- Entity IDs and names
- Temperature values
- Creation and modification timestamps

Perfect for an initial exploration of your data lake content.
SELECT
    id,
    name.value as room_name,
    temperature.value as temperature,
    from_iso8601_timestamp(temperature.observedAt) as temperature_observed_at,
    from_iso8601_timestamp(temperature.modifiedAt) as temperature_modified_at,
    from_iso8601_timestamp(createdAt) as entity_created_at,
    from_iso8601_timestamp(modifiedAt) as entity_modified_at
FROM garnetdb.room
WHERE type = 'Room'
    AND dt BETWEEN date_format(date_add('day', -30, now()), '%Y-%m-%d-00') AND date_format(date_add('day', 1, now()), '%Y-%m-%d-00')
LIMIT 10
If your query returns no results, check the date range in the dt BETWEEN clause. The example above uses now() to dynamically set the date range to the last 30 days. This will only return entities that were created or updated within the last 30 days. If your entities are older than that, you'll need to adjust the date range by increasing the number of days in date_add('day', -30, now()) to cover a longer time period, or use specific dates that match when your entities were created or last updated.
This simple query returns basic information about Room entities, giving you a first look at the data structure and content available in your data lake. When executed, you'll see results similar to the following:
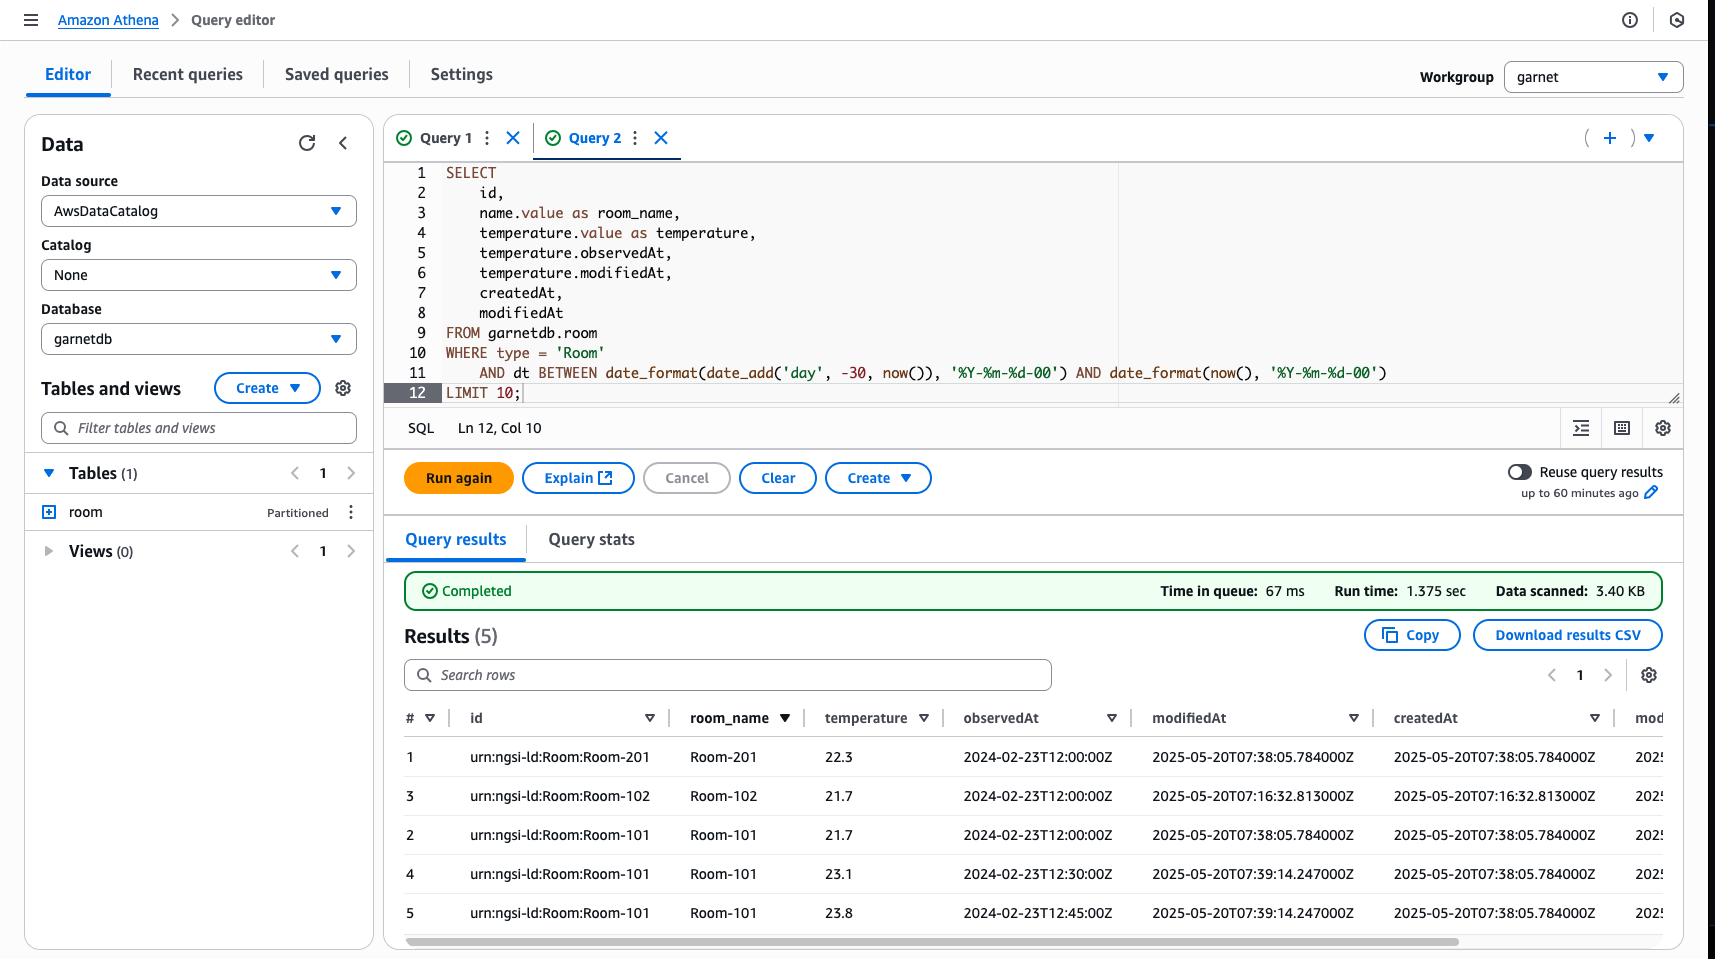
As shown in the screenshot, the query results display the entity IDs, room names, temperature values, and various timestamp fields. This gives you a comprehensive view of both the current state and historical context of your room entities. With this foundation, we can now move on to more advanced queries that extract specific insights from your data.
Extracting Meaningful Information
Now that we understand the basic structure of our data, let's extract more meaningful information by transforming the raw entity data into a more useful format:
- Summary
- SQL
This query transforms raw entity data into useful insights:
- Extracts room identifiers from URNs
- Formats temperature observation timestamps
- Identifies which building each room belongs to
- Shows hierarchical location paths

Results are ordered by temperature to quickly identify the warmest rooms.
SELECT
    split(id, ':')[4] as room_identifier,
    name.value as room_name,
    temperature.value as temperature,
    cast(from_iso8601_timestamp(temperature.observedAt) as timestamp) as observation_time,
    split(inBuilding.object, ':')[4] as building_id,
    scope as location_path
FROM garnetdb.room
WHERE type = 'Room'
    AND dt BETWEEN date_format(date_add('day', -30, now()), '%Y-%m-%d-00') AND date_format(date_add('day', 1, now()), '%Y-%m-%d-00')
ORDER BY temperature DESC;
This query extracts the room identifier from the full URN, retrieves the room's name and temperature, and converts the observation timestamp to a readable format. It also extracts the associated building identifier and shows the hierarchical location path from the scope. The results are ordered by temperature to identify the warmest rooms first, providing a clear view of temperature distribution across your building spaces.
Building on individual room analysis, we can now aggregate this data to understand patterns at the building level.
Analyzing Room Temperature by Building
After examining individual rooms, we can aggregate data to understand temperature patterns at the building level:
- Summary
- SQL
This query provides facility managers with key insights:
- Number of rooms in each building
- Temperature range (minimum and maximum)
- Average temperature per building

Results are ordered by average temperature, helping identify buildings that may need HVAC adjustments.
SELECT
    split(inBuilding.object, ':')[4] as building_id,
    count(DISTINCT id) as room_count,
    min(temperature.value) as min_temp,
    max(temperature.value) as max_temp,
    avg(temperature.value) as avg_temp
FROM garnetdb.room
WHERE type = 'Room'
    AND dt BETWEEN date_format(date_add('day', -30, now()), '%Y-%m-%d-00') AND date_format(date_add('day', 1, now()), '%Y-%m-%d-00')
GROUP BY split(inBuilding.object, ':')[4]
ORDER BY avg_temp DESC;
This query groups rooms by building to identify which building has the most rooms, the temperature range within each building, and the average temperature across all rooms in each building. This analysis helps facility managers understand temperature patterns across their property portfolio and identify buildings that might need heating or cooling system adjustments.
Analyzing Creation and Modification Patterns
With system attributes now available in the data lake, we can analyze entity lifecycle events to better understand the temporal aspects of your data:
- Summary
- SQL
This query analyzes temperature sensor data quality:
- When temperature values were observed by sensors
- When temperature data was last modified in the system
- Time lag between observation and system update

Useful for identifying sensor communication delays and data processing latency.
SELECT
    split(id, ':')[4] as room_id,
    cast(from_iso8601_timestamp(temperature.observedAt) as timestamp) as temp_observed,
    cast(from_iso8601_timestamp(temperature.modifiedAt) as timestamp) as temp_modified,
    date_diff('minute',
              cast(from_iso8601_timestamp(temperature.observedAt) as timestamp),
              cast(from_iso8601_timestamp(temperature.modifiedAt) as timestamp)) as processing_delay_minutes
FROM garnetdb.room
WHERE type = 'Room'
    AND dt BETWEEN date_format(date_add('day', -30, now()), '%Y-%m-%d-00') AND date_format(now(), '%Y-%m-%d-00')
ORDER BY temp_observed;
This query helps identify the time lag between when temperature sensors observe values and when those values are processed and stored in the system. This information is valuable for monitoring sensor communication reliability and identifying potential delays in data processing pipelines.
Joining Multiple Entity Types
So far, we've been working with a single entity type (Room). To gain deeper insights, we need to connect rooms with the buildings they're located in. First, let's create a table for Building entities. Remember to replace {GarnetDataLakeBucket} with your actual S3 bucket name in the SQL statement:
- Summary
- SQL
This SQL statement creates an external table that:
- Defines the structure of Building entities in your data lake
- Includes fields for building name, location, and address
- Configures partitioning by entity type and datetime
- Uses the same S3 location as the Room table

Creating this table allows you to join building data with room data for comprehensive analysis.
CREATE EXTERNAL TABLE IF NOT EXISTS garnetdb.building (
  id string,
  createdAt string,
  modifiedAt string,
  scope string,
  name struct<
    createdAt: string,
    value: string,
    modifiedAt: string
  >,
  location struct<
    createdAt: string,
    value: struct<
      type: string,
      coordinates: array<double>
    >,
    modifiedAt: string
  >,
  address struct<
    createdAt: string,
    value: struct<
      streetAddress: string,
      addressLocality: string,
      postalCode: string
    >,
    modifiedAt: string
  >
)
PARTITIONED BY (
    type string,
    dt string
)
ROW FORMAT serde 'org.openx.data.jsonserde.JsonSerDe'
WITH SERDEPROPERTIES (
'serialization.format' = '1',
'ignore.malformed.json' = 'true'
)
LOCATION 's3://{GarnetDataLakeBucket}/' -- Replace {GarnetDataLakeBucket} with your actual S3 bucket name
TBLPROPERTIES (
    'classification'='json',
    'projection.type.values' = 'Building',
    'projection.enabled'= 'true',
    'projection.dt.type'= 'date',
    'projection.dt.format' = 'yyyy-MM-dd-HH',
    'projection.dt.range' = '2024-01-01-00,NOW',
    'projection.dt.interval' = '1',
    'projection.dt.interval.unit' = 'HOURS',
    'projection.type.type' = 'enum'
)
With the building table structure defined, we can now explore advanced analytical techniques that combine multiple entity types.
Analyzing Spatial Patterns
Now that we have both room and building tables, we can extend our analysis to include spatial patterns, examining how temperature variations relate to building locations:
- Summary
- SQL
This query combines spatial and temperature data to:
- Link rooms to their building locations
- Calculate distances in meters from a central reference point (London coordinates)
- Show temperature variations by location
- Filter for buildings within a specific radius (optional)

Perfect for analyzing how building position affects temperature patterns.
WITH room_data AS (
    SELECT
        id as room_id,
        split(id, ':')[4] as room_name,
        temperature.value as temperature,
        from_iso8601_timestamp(temperature.observedAt) as measured_at,
        inBuilding.object as building_id
    FROM garnetdb.room
    WHERE type = 'Room'
        AND dt BETWEEN date_format(date_add('day', -30, now()), '%Y-%m-%d-00') AND date_format(date_add('day', 1, now()), '%Y-%m-%d-00')
),
building_data AS (
    SELECT
        id as building_id,
        name.value as building_name,
        location.value.coordinates[1] as longitude,
        location.value.coordinates[2] as latitude
    FROM (
        SELECT
            id,
            name,
            location,
            ROW_NUMBER() OVER (PARTITION BY id ORDER BY from_iso8601_timestamp(modifiedAt) DESC) as rn
        FROM garnetdb.building
        WHERE type = 'Building'
            AND dt BETWEEN date_format(date_add('day', -30, now()), '%Y-%m-%d-00') AND date_format(date_add('day', 1, now()), '%Y-%m-%d-%H')
            AND location IS NOT NULL
            AND location.value IS NOT NULL
            AND location.value.coordinates IS NOT NULL
            AND cardinality(location.value.coordinates) >= 2
    ) ranked_buildings
    WHERE rn = 1
)
SELECT
    r.room_name,
    r.temperature,
    r.measured_at,
    b.building_name,
    b.longitude,
    b.latitude,
    ROUND(st_distance(
        to_spherical_geography(st_point(b.longitude, b.latitude)),
        to_spherical_geography(st_point(-0.1094022, 51.5172398)) -- London coordinates
    ), 2) as distance_from_center_meters
FROM room_data r
JOIN building_data b ON r.building_id = b.building_id
WHERE st_distance(
    to_spherical_geography(st_point(b.longitude, b.latitude)),
    to_spherical_geography(st_point(-0.1094022, 51.5172398))
) < 5000 -- Buildings within 5km of center
ORDER BY distance_from_center_meters;
We can also explore relationships between rooms and buildings using basic building information, even when detailed location data isn't available.
Analyzing Room-Building Relationships
We can also analyze the relationships between rooms and their buildings using basic building information:
- Summary
- SQL
This query combines room and building data to:
- Link rooms to their building names
- Show temperature readings with building context
- Count rooms per building
- Analyze temperature patterns by building
- Use hierarchical location paths from scope

Perfect for understanding building occupancy and temperature distribution patterns.
WITH room_data AS (
    SELECT
        id as room_id,
        split(id, ':')[4] as room_name,
        temperature.value as temperature,
        from_iso8601_timestamp(temperature.observedAt) as measured_at,
        inBuilding.object as building_id,
        scope as location_hierarchy
    FROM garnetdb.room
    WHERE type = 'Room'
        AND dt BETWEEN date_format(date_add('day', -30, now()), '%Y-%m-%d-00') AND date_format(date_add('day', 1, now()), '%Y-%m-%d-00')
),
building_data AS (
    SELECT
        id as building_id,
        name.value as building_name,
        scope as building_location_hierarchy
    FROM garnetdb.building
    WHERE type = 'Building'
        AND dt BETWEEN date_format(date_add('day', -30, now()), '%Y-%m-%d-00') AND date_format(date_add('day', 1, now()), '%Y-%m-%d-00')
)
SELECT
    r.room_name,
    r.temperature,
    r.measured_at,
    b.building_name,
    r.location_hierarchy,
    b.building_location_hierarchy
FROM room_data r
JOIN building_data b ON r.building_id = b.building_id
ORDER BY b.building_name, r.room_name;
Beyond spatial analysis, we can also examine temperature consistency patterns to identify potential maintenance issues.
Identifying Temperature Variations
Temperature consistency is a key indicator of HVAC system performance and building insulation quality. By analyzing temperature variations over time, we can identify rooms that may need maintenance attention:
- Summary
- SQL
This query helps facility managers find rooms that need attention:
- Calculates temperature statistics for each room (min, max, avg)
- Measures temperature variation (max - min)
- Filters for rooms with variations exceeding 5 degrees

Perfect for identifying HVAC issues, thermostat problems, or rooms with poor insulation.
WITH room_temps AS (
    SELECT
        split(id, ':')[4] as room_id,
        split(inBuilding.object, ':')[4] as building_id,
        name.value as room_name,
        temperature.value as temperature,
        cast(from_iso8601_timestamp(temperature.observedAt) as timestamp) as observation_time,
        scope
    FROM garnetdb.room
    WHERE type = 'Room'
        AND dt BETWEEN date_format(date_add('day', -30, now()), '%Y-%m-%d-00') AND date_format(date_add('day', 1, now()), '%Y-%m-%d-00')
)
SELECT
    room_id,
    room_name,
    building_id,
    MIN(temperature) as min_temp,
    MAX(temperature) as max_temp,
    AVG(temperature) as avg_temp,
    MAX(temperature) - MIN(temperature) as temp_variation
FROM room_temps
GROUP BY room_id, room_name, building_id
HAVING MAX(temperature) - MIN(temperature) > 5
ORDER BY temp_variation DESC;
Moving beyond individual room analysis, we can now combine all our analytical techniques to create comprehensive views of the entire smart building environment.
Traversing the Knowledge Graph
With both room and building tables defined, we can now follow the relationships between them to create a comprehensive view of our smart building environment:
- Summary
- SQL
This query demonstrates knowledge graph traversal by:
- Following relationships between rooms and buildings
- Combining temperature data with building location information
- Filtering out buildings without location data
- Organizing results by city and building name

Provides a complete picture of your smart building portfolio with all relevant information in one view.
WITH room_data AS (
    SELECT
        id as room_id,
        name.value as room_name,
        temperature.value as temperature,
        from_iso8601_timestamp(temperature.observedAt) as observation_time,
        inBuilding.object as building_id,
        scope as room_location
    FROM garnetdb.room
    WHERE type = 'Room'
        AND dt BETWEEN date_format(date_add('day', -30, now()), '%Y-%m-%d-00') AND date_format(date_add('day', 1, now()), '%Y-%m-%d-00')
),
building_data AS (
    SELECT
        id as building_id,
        name.value as building_name,
        address.value.addressLocality as city,
        address.value.streetAddress as street,
        -- Note: SQL array indices start at 1
        location.value.coordinates[1] as longitude,
        location.value.coordinates[2] as latitude
    FROM garnetdb.building
    WHERE type = 'Building'
        -- Filter out buildings without location data
        AND location IS NOT NULL
        AND location.value IS NOT NULL
        AND location.value.coordinates IS NOT NULL
        AND dt BETWEEN date_format(date_add('day', -30, now()), '%Y-%m-%d-00') AND date_format(date_add('day', 1, now()), '%Y-%m-%d-00')
)
SELECT
    r.room_id,
    r.room_name,
    r.temperature,
    r.observation_time,
    b.building_name,
    b.city,
    b.street,
    b.longitude,
    b.latitude
FROM room_data r
JOIN building_data b ON r.building_id = b.building_id
ORDER BY b.city, b.building_name, r.room_name;
This comprehensive query brings together all the elements we've explored so far, creating a complete view of your smart building environment. By joining room and building data, you can see the full picture of your smart building portfolio, including temperature readings, observation times, and geographic information. This type of knowledge graph traversal is particularly powerful for complex analyses that span multiple entity types.
These queries leverage Athena's support for Presto SQL, enabling sophisticated analysis of your historical context data. The results might reveal patterns not immediately apparent through real-time monitoring, such as rooms with consistent temperature control issues or the impact of building orientation on temperature variations.
Visualizing Context Evolution
The structured nature of your data lake enables sophisticated visualization through tools like Amazon QuickSight, Grafana, or Amazon Managed Grafana. You might create dashboards that show how room temperatures correlate with occupancy patterns, or how energy usage varies across different building zones throughout the day.
For operational insights, combining real-time data from your NGSI-LD subscriptions with historical analysis from the data lake enables both immediate response to conditions and long-term pattern analysis, providing a complete picture of your smart building operations.
The data lake's standardized structure also makes it straightforward to feed historical context into machine learning models through Amazon SageMaker. You could develop predictive maintenance models based on equipment performance patterns, or optimize building operations based on historical usage patterns.
More detailed guidance on visualizing your data and building interactive dashboards will be provided in the upcoming "Building Smart Solutions" section of our documentation. This section will cover best practices for creating effective visualizations, integrating with various visualization tools, and developing end-to-end smart applications that leverage your historical data.
Future Improvements
The data lake management process can be further automated by leveraging Garnet Framework's Knowledge Graph Discovery capabilities. A scheduled task could periodically discover available entity types and their attributes, automatically creating or updating corresponding Athena tables. This approach builds on the same discovery mechanisms used for API exploration, ensuring your analytics capabilities evolve seamlessly with your knowledge graph structure and maintaining consistency between your real-time context management and historical analysis capabilities.
Through this combination of real-time context management, knowledge graph discovery, and efficient historical analysis, Garnet Framework enables you to build increasingly sophisticated smart solutions that learn and improve from historical patterns while maintaining real-time responsiveness to current conditions.